COVID-2019 Dynamic plots
I have made some deep-dives into programming with R for the purpose of
visualising the coronavirus world-wide using the Gapminder tools. The source
code is available on GitHub.
The graphs are configurable but looks something like the figure below.
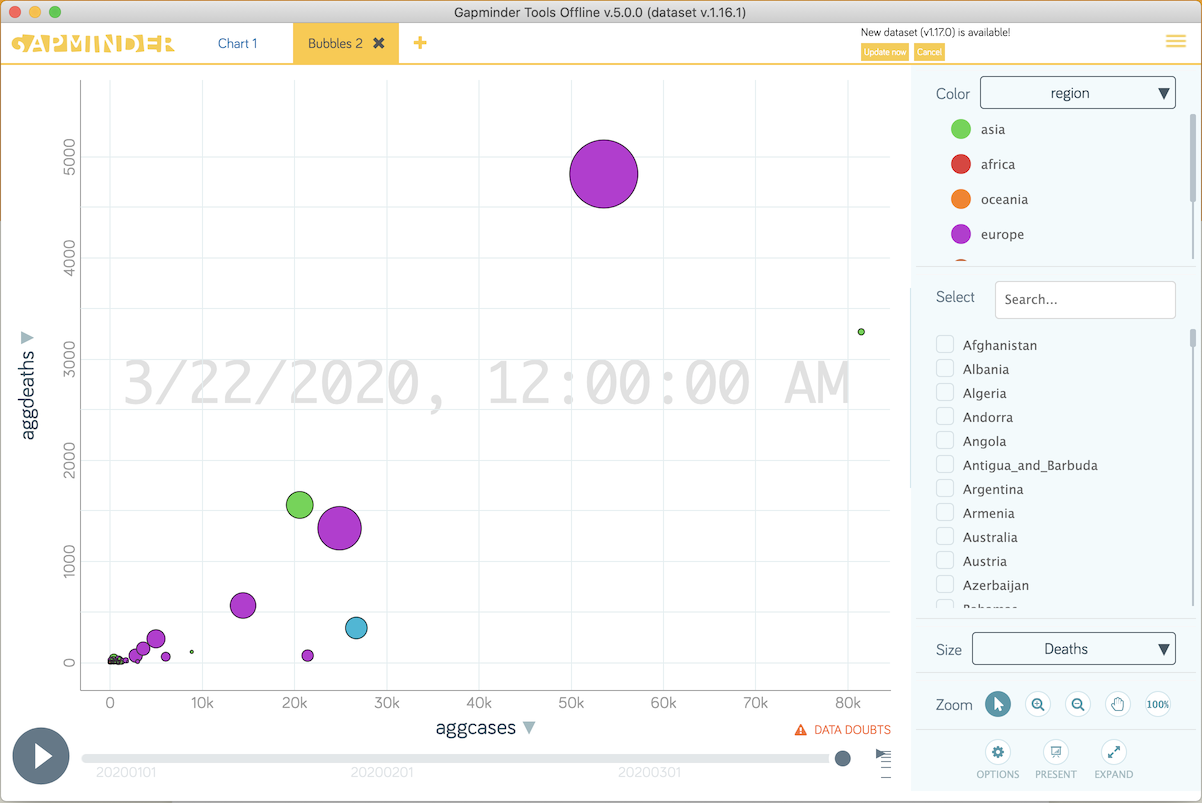 I wrote a brief article on
LinkedIn about it, and you can test it out on
this page.
I wrote a brief article on
LinkedIn about it, and you can test it out on
this page.
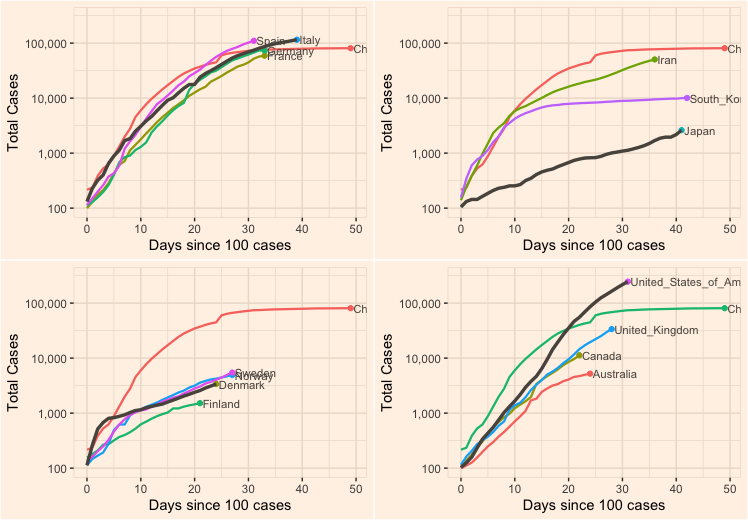
Comparing countries
Inspired by graphs I saw published in Financial Times, I added some plotting features to the R script. I mainly use the ggplot2 and cowplot packages for this.
The code
The main purpose of the R script is to restructure the excel file into a format that 'Gapminder tools' understand. This entails the following steps: 1) Moving country name to first column, and 2) Changing the date format to YYYYMMDD and move to second column. The ECDC data only reported the daily cases and deaths, but the total numbers are also relevant. So I added columns for aggregated values. A column indicating the number of days since the 100'th case was added. Finally, each country was assigned a world region.
Here I have highlighted the key 'R' code elements that I used to achieve this.
Getting the data from the ECDC website
GET(url, authenticate(":", ":", type="ntlm"), write_disk(tempfile <- tempfile(fileext = ".xlsx")))
res <- read.xlsx(tempfile, 1)
Make unique list of countries
countries <- unique(ecdcdata %>% select(countriesAndTerritories))Loop through countries
for (row in 1:nrow(countries)) {
  cname = as.character(countries[row, "countriesAndTerritories"])
  countrydata <- subset(data, countriesAndTerritories == cname)
  result <- sumcountry(countrydata, regions, cname, MinCases)
    if (isFALSE(result) == FALSE) {
      tmpdf = rbind(tmpdf, result)
    }
  }
Adding up the cases and deaths
This is done in the function sumcases()
sumcountry <- function(scdata, regions, country, mincases) {
  for (row in 1:nrow(scdata)) {
      scdata[row, "dayssince100"] <- as.integer(date - d100)
      scdata[row, "date"] <- as.character(date, format="%Y%m%d")
      scdata[row, "days"] <- totdays
      scdata[row, "aggcases"] <- sumcases
      scdata[row, "aggdeaths"] <- sumdeaths
  } # end loop over dates
}
Writing the new file
row.names=FALSE is needed to get rid of R's index column.
gapm <- subset(df, select=c('countriesAndTerritories', 'date', 'dayssince100', 'aggcases', 'aggdeaths',
                             'cases', 'deaths', 'region')))
write.xlsx(gapm, "gapminder.xlsx", sheetName="countries", row.names=FALSE)